on
Internet Performance Monitoring and Visualisation
Internet is a slippery service to track due to the fluctuating and intangible nature of internet access. Some may take their Internet Service Provider’s (ISP) word that they are delivering internet performance that is up to the standard you are paying for, but not me. I can only shut my eyes at night with the confidence that my download and upload speeds, as well as latency, are up to scratch.
Internet speed checking websites are abundant, but they require a browser and only give you results from that point in time. To properly check that my ISP is delivering on their promise, I need a created a small application to automatically collect, store and visualise my internet connectivity performance. My application solution can continuously check the internet performance, archive the results and then visualise and aggregate the results.
Requirements
- A Linux based operating system (eg. Ubuntu).
- Docker installed on the system.
- Docker-compose installed on the system.
The Approach
We will generate the internet performance report by running a command line interface, then transform the results into a structure suited for importing into a relational database.
We will run a MySQL database running in a Docker container and schedule the run and import of the internet performance report in a crontab to import the data into the database.
Then we will hook up a Grafana container to the MySQL database so we can visualise the data set.
The following sections are an explanation of all the different components of this application.
The SpeedTest Command Line Tool
Ookla provides the speedtest command line tool which we will use to run the command line test and output the results in a csv format with the arguments: speedtest --progress=no --format=csv --output-header
Dockerised SpeedTest
For portability and stability, I prefer to package up tools into Docker containers. My speedtest Dockerfile looks like:
FROM ubuntu:bionic

ENV INSTALL_KEY=379CE192D401AB61
RUN apt-get update && apt-get install gnupg1 apt-transport-https dirmngr -y
RUN export DEB_DISTRO=bionic && \
    apt-key adv --keyserver keyserver.ubuntu.com --recv-keys $INSTALL_KEY && \
    echo "deb https://ookla.bintray.com/debian ${DEB_DISTRO} main" | tee  /etc/apt/sources.list.d/speedtest.list && \
    apt-get update && \
    apt-get install speedtest -y

RUN speedtest --accept-license

ENTRYPOINT ["speedtest"]
Place the above snippet in a file called Dockerfile and then when in the same directory as the file run the command docker build . -t speedtest to build the container.
Transform the Data
Whilst conveniently, the speedtest cli will output to csv, we need to do a slight transformation of the data to import it into the database.
The script we will use to transform the data is
import sys

filename = sys.argv[1]

with open(filename, "r") as f:
    lines = [line.strip() for line in f.readlines()]
    headings = lines[0].split(",")
    values = lines[1].split(",")

    for i, h in enumerate(headings):
        cur_heading = h
        cur_value = values[i]
        print(f"{cur_heading},{cur_value}")
This script will read the first argument (which should be a file name), then parse the results. It will print out the transformed data to standard out.
Dockerise the Transform script
Use the following Dockerfile to build a container which runs the transform script from the previous section
FROM python:3.8-alpine

COPY transform.py .

ENTRYPOINT ["python3", "transform.py"]
To build the docker container run docker build . -t transform.
Run the MySQL Database
Whilst it’s definitely possible to install and run the database directly on the host, I prefer to run the database in a container since it has a simpler installation and configuration process. With Docker, to install the database all you need to do is run a docker container, and to configure the database all we need to do is set environment variables in the container.
To ensure data persistence, we mount the data directory from the container onto the host system to ensure we don’t lose data between container restarts. Also, note we expose the port 3306 to the host so we can connect from the host to the MySQL process in the container.
version: '3.1'

services:
  db:
    image: mysql:8
    restart: always
    environment:
      MYSQL_ROOT_PASSWORD: goodpassword
      MYSQL_DATABASE: HOME
    volumes:
      - ./data:/var/lib/mysql
    ports:
      - 3306:3306
    restart: always
Start the database by recording the above yaml into a file called docker-compose.yaml and then run docker-compose up -d to start the container.
Create the table
We need a script to create a network_logs table in the database:
CREATE TABLE IF NOT EXISTS network_logs (
    metric VARCHAR(255),
    value DOUBLE,
    ts TIMESTAMP DEFAULT CURRENT_TIMESTAMP
);
Record this script in a file called create.sql.
Script it all together
Now that we have a speedtest container, a transform container and a MySQL container, we can look at scripting the data importing process.
First we set some variables which we will use later:
host=localhost
user=root
password=goodpassword
database=HOME
We run the speedtest container:
docker run speedtest --progress=no --format=csv --output-header > /home/daniel/speedtest/data/data.csv
This writes the output from the speedtest into a data.csv file.
Next, we transform the data:
docker run -v /home/daniel/speedtest/data:/data transform /data/data.csv > /home/daniel/speedtest/data/transform.csv
We mount the data.csv file from the host into the docker container so it can be read, then write the output to transform.csv.
Then, we create the required tables in the database:
docker run -i --net=host -v /home/daniel/speedtest/data:/data mysql mysql --local-infile=1 -h "${host}" -u "${user}" --password="${password}" --database="${database}" < /home/daniel/speedtest/create.sql
Finally, we insert the data into the table:
docker run -i --net=host -v /home/daniel/speedtest/data:/data mysql:8 mysql --local-infile=1 -h "${host}" -u "${user}" --password="${password}" --database="${database}" < /home/daniel/speedtest/insert.sql
All together, the script should look like
#!/usr/bin/env bash
PATH=/usr/local/sbin:/usr/local/bin:/usr/sbin:/usr/bin:/sbin:/bin:/usr/games:/usr/local/games:/snap/bin
set -euox pipefail

host=localhost
user=root
password=goodpassword
database=HOME

docker run speedtest --progress=no --format=csv --output-header > /home/daniel/speedtest/data/data.csv
docker run -v /home/daniel/speedtest/data:/data transform /data/data.csv > /home/daniel/speedtest/data/transform.csv

docker run -i --net=host -v /home/daniel/speedtest/data:/data mysql mysql --local-infile=1 -h "${host}" -u "${user}" --password="${password}" --database="${database}" < /home/daniel/speedtest/create.sql
docker run -i --net=host -v /home/daniel/speedtest/data:/data mysql:8 mysql --local-infile=1 -h "${host}" -u "${user}" --password="${password}" --database="${database}" < /home/daniel/speedtest/insert.sql
Save this in a file called run.sh
Note that we set the PATH variables since when we set the crontab we need to set the PATH variable outselves.
Schedule the script with Crontab
Crontabs are a convient way to schedule scripts to run on a regular schedule.
To edit the crontab file, use crontab -e. We then edit the crontab file with (Vi)[https://en.wikipedia.org/wiki/Vi] commands.
Here is a link to a reference on (how to write crontabs)[https://www.adminschoice.com/crontab-quick-reference].
And here is an example of a crontab I used to run my application:
*/5 * * * * speedtest/run.sh
This crontab runs the script speedtest/run.sh every 5 minutes.
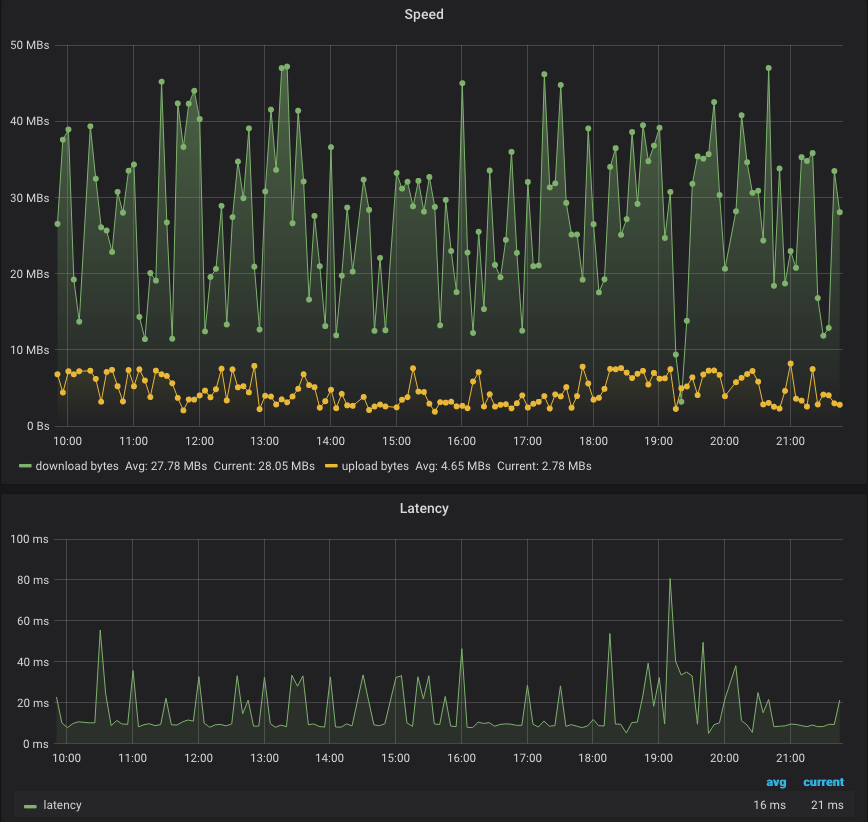
Grafana Visualisation
Similar to the MySQL database, we run our visualisation tool Grafana with Docker:
version: '3'

services:
  grafana:
    image: grafana/grafana:6.7.3
    environment:
      TZ: Australia/Melbourne
      GF_INSTALL_PLUGINS: 'btplc-trend-box-panel,pr0ps-trackmap-panel,grafana-strava-datasource'
      GF_STRAVA_DS_DATA_PATH: /var/lib/grafana/strava
    ports:
      - 3000:3000
    volumes:
      - grafanastorage:/var/lib/grafana
    restart: always

volumes:
  grafanastorage:
Then run this file with docker-compose up -d -f <filename>.
Then in a web browser go to http://<ip address of linux server>:3000/ and login with the username admin and password admin.
You will need to add a MySQL database and enter the details of your MySQL database you created earlier.
You can then play around and try to create your own dashboard. Alternatively, if you have followed the above steps exactly, then you can copy my Grafana dashboard JSON model, found at the bottom of this document.
My Internet Performance Grafana Dashboard Model
{
  "annotations": {
    "list": [
      {
        "builtIn": 1,
        "datasource": "-- Grafana --",
        "enable": true,
        "hide": true,
        "iconColor": "rgba(0, 211, 255, 1)",
        "name": "Annotations & Alerts",
        "type": "dashboard"
      }
    ]
  },
  "editable": true,
  "gnetId": null,
  "graphTooltip": 0,
  "id": 2,
  "links": [],
  "panels": [
    {
      "aliasColors": {},
      "bars": false,
      "dashLength": 10,
      "dashes": false,
      "datasource": null,
      "fill": 1,
      "fillGradient": 0,
      "gridPos": {
        "h": 9,
        "w": 24,
        "x": 0,
        "y": 0
      },
      "hiddenSeries": false,
      "id": 4,
      "legend": {
        "alignAsTable": true,
        "avg": true,
        "current": true,
        "max": false,
        "min": false,
        "rightSide": false,
        "show": true,
        "total": false,
        "values": true
      },
      "lines": true,
      "linewidth": 1,
      "nullPointMode": "null",
      "options": {
        "dataLinks": []
      },
      "percentage": false,
      "pointradius": 2,
      "points": false,
      "renderer": "flot",
      "seriesOverrides": [],
      "spaceLength": 10,
      "stack": false,
      "steppedLine": false,
      "targets": [
        {
          "format": "time_series",
          "group": [],
          "metricColumn": "metric",
          "rawQuery": false,
          "rawSql": "SELECT\n  ts AS \"time\",\n  metric AS metric,\n  value\nFROM network_logs\nWHERE\n  $__timeFilter(ts) AND\n  metric = 'latency'\nORDER BY ts",
          "refId": "A",
          "select": [
            [
              {
                "params": [
                  "value"
                ],
                "type": "column"
              }
            ]
          ],
          "table": "network_logs",
          "timeColumn": "ts",
          "timeColumnType": "timestamp",
          "where": [
            {
              "name": "$__timeFilter",
              "params": [],
              "type": "macro"
            },
            {
              "datatype": "varchar",
              "name": "",
              "params": [
                "metric",
                "=",
                "'latency'"
              ],
              "type": "expression"
            }
          ]
        }
      ],
      "thresholds": [],
      "timeFrom": null,
      "timeRegions": [],
      "timeShift": null,
      "title": "Latency",
      "tooltip": {
        "shared": true,
        "sort": 0,
        "value_type": "individual"
      },
      "type": "graph",
      "xaxis": {
        "buckets": null,
        "mode": "time",
        "name": null,
        "show": true,
        "values": []
      },
      "yaxes": [
        {
          "format": "ms",
          "label": null,
          "logBase": 1,
          "max": null,
          "min": null,
          "show": true
        },
        {
          "format": "short",
          "label": null,
          "logBase": 1,
          "max": null,
          "min": null,
          "show": false
        }
      ],
      "yaxis": {
        "align": false,
        "alignLevel": null
      }
    },
    {
      "aliasColors": {},
      "bars": false,
      "dashLength": 10,
      "dashes": false,
      "datasource": null,
      "fill": 2,
      "fillGradient": 5,
      "gridPos": {
        "h": 13,
        "w": 24,
        "x": 0,
        "y": 9
      },
      "hiddenSeries": false,
      "id": 2,
      "legend": {
        "alignAsTable": false,
        "avg": true,
        "current": true,
        "max": false,
        "min": false,
        "rightSide": false,
        "show": true,
        "total": false,
        "values": true
      },
      "lines": true,
      "linewidth": 1,
      "nullPointMode": "null",
      "options": {
        "dataLinks": []
      },
      "percentage": false,
      "pointradius": 2,
      "points": true,
      "renderer": "flot",
      "seriesOverrides": [],
      "spaceLength": 10,
      "stack": false,
      "steppedLine": false,
      "targets": [
        {
          "format": "time_series",
          "group": [],
          "metricColumn": "metric",
          "rawQuery": false,
          "rawSql": "SELECT\n  ts AS \"time\",\n  metric AS metric,\n  value\nFROM network_logs\nWHERE\n  $__timeFilter(ts) AND\n  metric IN ('download bytes','upload bytes')\nORDER BY ts",
          "refId": "A",
          "select": [
            [
              {
                "params": [
                  "value"
                ],
                "type": "column"
              }
            ]
          ],
          "table": "network_logs",
          "timeColumn": "ts",
          "timeColumnType": "timestamp",
          "where": [
            {
              "name": "$__timeFilter",
              "params": [],
              "type": "macro"
            },
            {
              "datatype": "varchar",
              "name": "",
              "params": [
                "metric",
                "IN",
                "('download bytes','upload bytes')"
              ],
              "type": "expression"
            }
          ]
        }
      ],
      "thresholds": [],
      "timeFrom": null,
      "timeRegions": [],
      "timeShift": null,
      "title": "Speed",
      "tooltip": {
        "shared": true,
        "sort": 0,
        "value_type": "individual"
      },
      "type": "graph",
      "xaxis": {
        "buckets": null,
        "mode": "time",
        "name": null,
        "show": true,
        "values": []
      },
      "yaxes": [
        {
          "format": "Bps",
          "label": null,
          "logBase": 1,
          "max": null,
          "min": null,
          "show": true
        },
        {
          "format": "short",
          "label": null,
          "logBase": 1,
          "max": null,
          "min": null,
          "show": false
        }
      ],
      "yaxis": {
        "align": false,
        "alignLevel": null
      }
    }
  ],
  "schemaVersion": 22,
  "style": "dark",
  "tags": [],
  "templating": {
    "list": []
  },
  "time": {
    "from": "now-6h",
    "to": "now"
  },
  "timepicker": {
    "refresh_intervals": [
      "5s",
      "10s",
      "30s",
      "1m",
      "5m",
      "15m",
      "30m",
      "1h",
      "2h",
      "1d"
    ]
  },
  "timezone": "",
  "title": "Internet",
  "uid": "5PuTz-OGk",
  "variables": {
    "list": []
  },
  "version": 3
}